Gruffでベンチマークをグラフ化するBenchmarkXをリリースしました
BenchmarkX というRubyのライブラリを作成しました。これは通常のBenchmarkモジュール(benchmark.rb)を拡張して、その結果をGruff を用いた美しいグラフとして出力します。
- GitHub: http://github.com/keita/benchmarkx/wikis/home
- RubyForge: http://rubyforge.org/projects/benchmarkx/
- API: http://benchmarkx.rubyforge.org/
インストール
% sudo gem install benchmarkx
使い方
ほとんど通常の Benchmark モジュールと一緒です。
require "benchmarkx"

BenchmarkX.bm |x| do
    # グラフのファイル名を設定します
    x.filename = "graph.png"
    # グラフの題名を設定します
    x.gruff.title = "#{n} times iterations of `a = \"1\"'"
    x.report("for:")   {for i in 1..n; a = "1"; end} # Benchmark::measure
    x.report("times:") {n.times do   ; a = "1"; end}
    x.report("upto:")  {1.upto(n) do ; a = "1"; end}
end
これで次のようなグラフが作成されます。
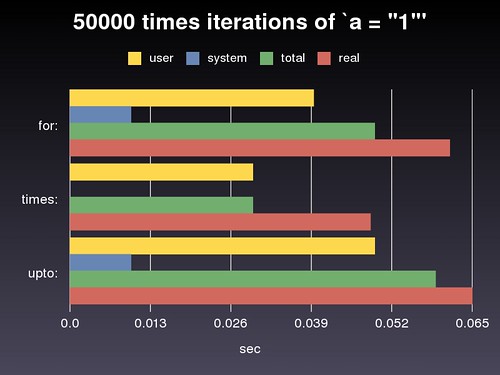
また標準出力に通常のテキスト版の結果を表示します。
50000 times iterations of `a = "1"'
             user     system      total        real
for:     0.040000   0.010000   0.050000 (  0.062325)
times:   0.030000   0.000000   0.030000 (  0.049322)
upto:    0.050000   0.010000   0.060000 (  0.065992)